Nascemos com o propósito de realizar os sonhos de quem sempre quis ter um lar mobiliado do seu jeito!
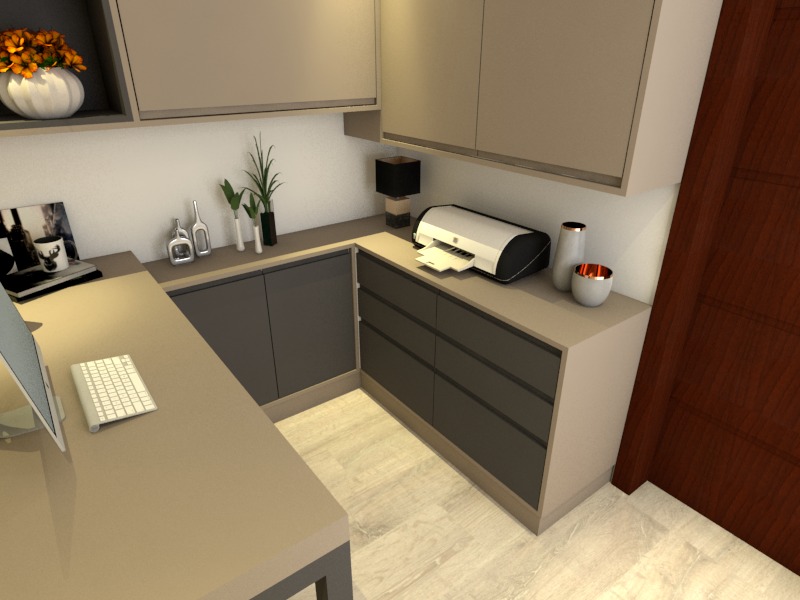
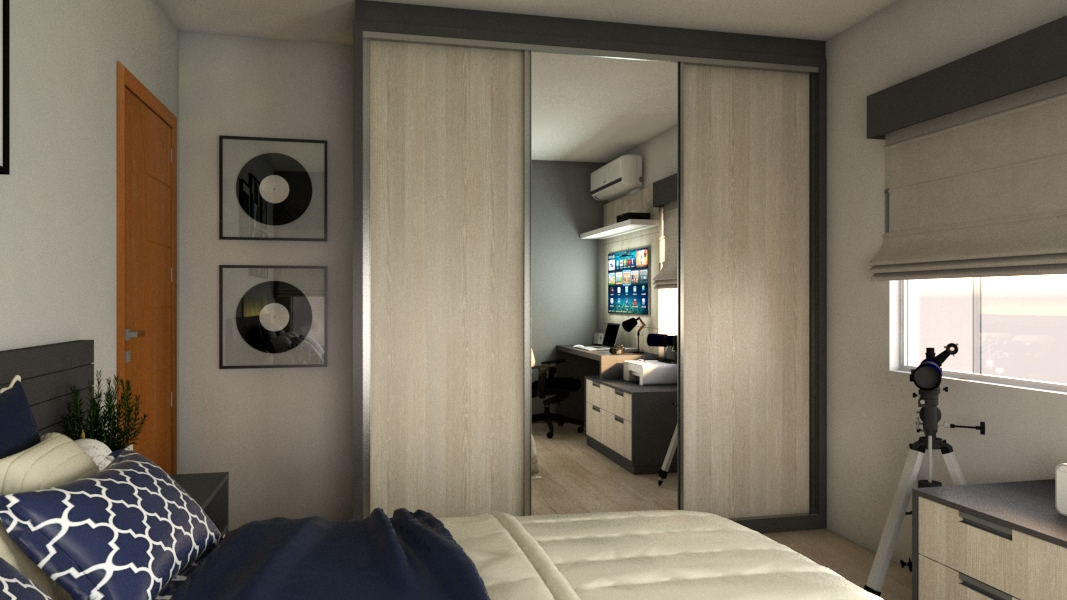
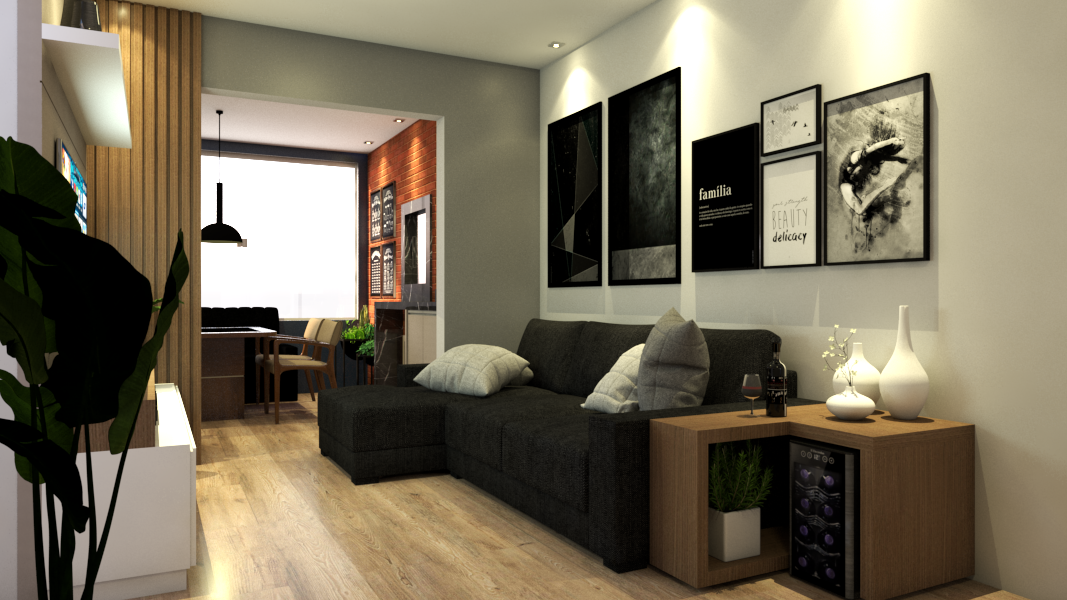
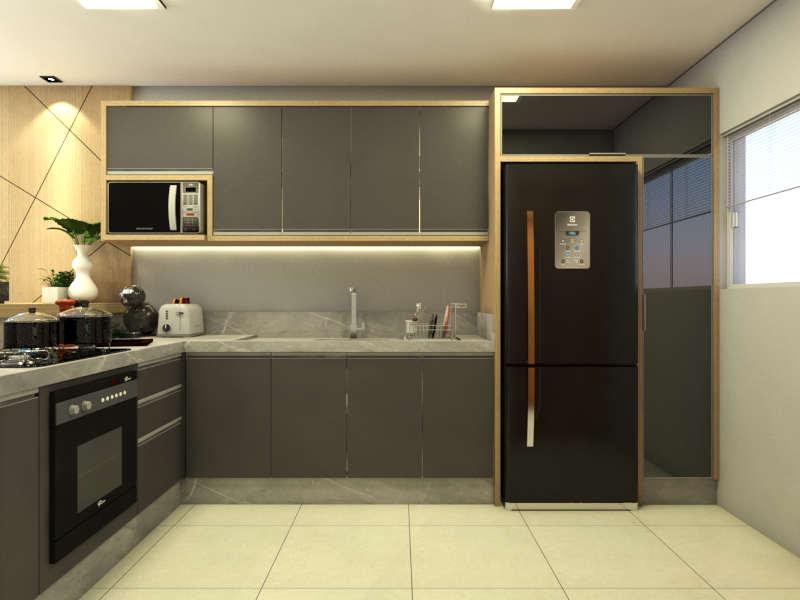
Para isso, contamos com um marceneiro-chefe com 30 anos de experiência em marcenaria, que supervisiona todo o trabalho de fabricação de nossos móveis em MDF.
Para os projetos dos móveis, temos uma equipe especializada e antenada com as últimas tendências do mercado de móveis sob medida e design de interiores.
Atuamos principalmente em Jaraguá do Sul – SC e região, e estamos expandindo nossas operações por vários estados do Brasil.